How Trading With Price Action Becomes Simple Once You Read Structure Instead of Indicators
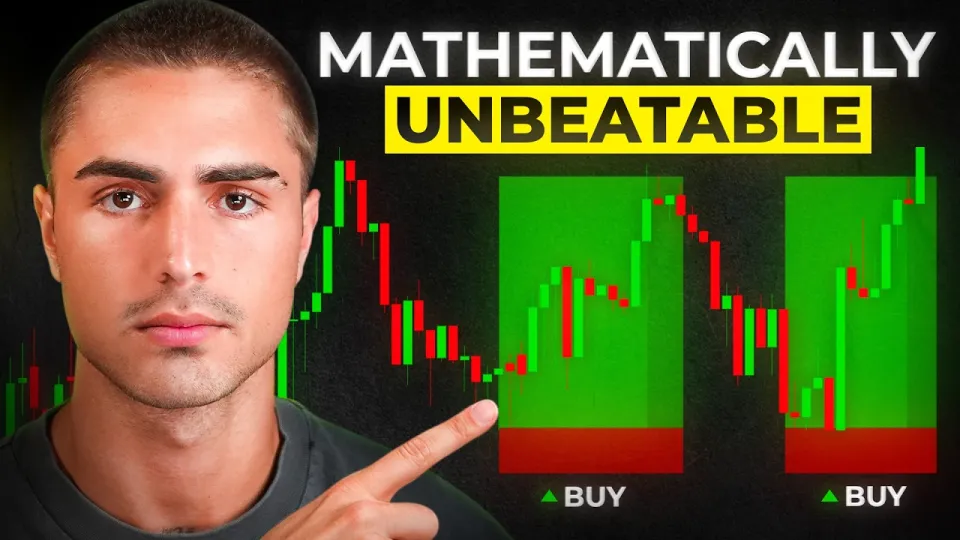
Video: Once You Learn Price Action, Trading Becomes Embarrassingly Simple
Need articles like this for your video? They help promote it on YouTube and Google — order them in the Telegram bot @sat_sit_bot. It writes articles around your video, embeds the video and publishes them on popular niche websites (no ads). Free trial — 50 articles.
· based on the channel TJR
Trading with price action means reading the chart itself — structure, liquidity and candle behaviour — instead of stacking lagging indicators on top of it, and that shift is what makes decisions feel simple rather than noisy. Once you can identify a break of structure, the origin of the move and the retracement that follows, most of the chart stops being a mystery and starts being a short list of repeatable scenarios. The full framework TJR teaches is available through the trading blueprint, and the video below is the reasoning behind it.
What price action trading actually asks you to look at
Price action is a method of reading intent from the chart: who is aggressive, where stops sit, and which side is trapped. Instead of asking what an oscillator says, you ask where price came from, how it left that area, and whether the return to it is weak or strong. That is the whole discipline, and it is why experienced traders can describe a setup in one sentence while beginners need five indicators to say the same thing.
The practical checklist is short:
- Mark the swing highs and swing lows that define the current range or trend.
- Identify the most recent break of structure — the candle close beyond a prior swing that changes the short-term direction.
- Locate the origin of that impulse: the last consolidation, order block or imbalance price left behind.
- Wait for price to return to that area rather than entering on the breakout candle.
- Define invalidation before entry, so the stop is a structural level and not a random number.
Everything else — moving averages, RSI, volume profiles — becomes optional context. None of it is forbidden, but none of it replaces the question of where the liquidity is.
Why the retracement is the trade and the break is only the signal
The break of structure tells you the market changed direction; the retracement tells you whether you get a good price. This is the single point that separates patient traders from the crowd that buys the top of every impulse and sells the bottom of every flush. A break is information, not an entry.
In practice, when price breaks a swing high, two things can happen. Either it continues immediately and you miss it, or it comes back to the origin of the move, fills the orders left behind, and then continues. The second scenario is far more common on intraday charts, and it is the one you can plan for. Waiting for the retracement also gives you a tighter stop, which means a smaller loss when the idea is wrong — the same edge with a better risk-to-reward ratio.
The trap after the break is what catches most people. Price pushes past a swing, retail traders enter in the direction of the break, and then price reverses to collect the liquidity sitting below those new positions before continuing. Recognising that pattern is not about predicting the future; it is about refusing to be the liquidity.
How to stop overcomplicating the chart
Overcomplication is usually a symptom of not having a defined setup, so the trader keeps adding tools to cover the uncertainty. If you cannot describe your entry in two sentences, you do not have a strategy yet — you have a mood. Reducing the chart to structure, a key level and a trigger is the fastest way to make trading feel manageable.
A workable simplification:
- Use one timeframe for direction and one for execution, nothing more.
- Keep a maximum of two marked levels on the chart at any time.
- Write the setup rules down before the session, including what invalidates the idea.
- Review the day in a journal with screenshots, so the pattern is documented rather than remembered.
- Cut any tool that has not changed a decision in the last twenty trades.
The traders who describe price action as making the chart easier to read are not exaggerating; they have simply removed the inputs that contradict each other. When three indicators disagree, the chart looks chaotic. When you only ask where structure broke and where price is returning, the chart becomes a yes-or-no question.
Why 1-minute scalping punishes beginners so hard
One-minute scalping is the hardest environment to learn in because it compresses the number of decisions and the number of mistakes into a single session. Spreads, commissions and slippage take a larger share of each move, and a single tilt can erase a week of careful work. Many traders describe cycling through multiple paid courses and still blowing accounts, and the timeframe is usually part of the reason.
The maths is unforgiving. If your average win on a 1-minute chart is a few ticks and your stop is nearly the same size, you need a high win rate just to break even after costs. Add overtrading after a loss and the account drains regardless of how good the setup looked. Moving the same price action logic to a 5-minute or 15-minute chart gives the trade room to breathe, reduces the number of entries per day, and makes the cost per trade a smaller fraction of the expected move.
None of this means fast trading is impossible. It means the learning phase should not happen at the fastest speed available. Structure, retracement and invalidation are identical concepts on every timeframe; only the noise and the cost change.
The psychology of waiting for the break of structure
Patience is the actual skill being tested, not pattern recognition. Waiting for a confirmed break, then waiting again for the pullback, means sitting through long stretches where nothing is valid — and that boredom is what pushes traders into low-quality entries. The market pays for that discipline precisely because most participants refuse to accept it.
A few habits that make waiting easier:
- Set alerts at the structural levels instead of staring at the chart.
- Define a maximum number of trades per session before you start.
- Treat a no-trade day as a completed day, not a failed one.
- Size positions so that a single loss does not change your behaviour on the next setup.
- Log every entry you skipped and why, so patience becomes measurable.
Traders who have been at it for a year and still feel lost often describe the same loop: stop out, overtrade, tilt, repeat. Breaking that loop is rarely about a new indicator. It is about narrowing the playbook until execution becomes boring.
Common questions from traders learning price action
"I keep entering on the breakout and getting stopped — what am I missing?" You are likely entering where the crowd enters, which is exactly where the liquidity sits. Wait for the return to the origin of the move and let the stop sit beyond the structural level.
"How many courses do I need before this works?" The number is not the variable. A trader who has finished four courses and still blows accounts usually lacks a written rule set and a journal, not more material.
"Is 1-minute scalping realistic for a beginner?" It is realistic only after costs, execution speed and emotional control are already handled. Most learners do better documenting setups on higher timeframes first.
"How do I know a break is real?" A close beyond the swing level, followed by a reaction, is stronger evidence than a wick through it. Combine that with where price returns and how it behaves there.
Useful links
- The exact system for becoming a full-time profitable trader
- Indicators used daily
- Funded account raffle entry
- Alpha Futures funded accounts, 10% off
- Lucid Trading, 40% off
- Tradeify funded accounts, 30% off
- TradeZella trading journal
- HeroFX broker
Final thoughts on making trading simple
Price action does not make trading easy — it makes it legible. Structure, the origin of a move, the retracement and a clear invalidation give you a small number of decisions to make well, and that is a far better foundation than a screen full of indicators that disagree. The traders who progress fastest are the ones who shrink their playbook, journal the results and stop paying for speed they cannot yet handle. TJR built this breakdown around exactly that idea: learn the structure first, then let execution become repetitive. If you want the complete framework, start with the trading blueprint and treat it as a rulebook rather than entertainment.
Key takeaways
- Price action reads structure, liquidity and traps directly from the candle chart, without lagging indicators.
- The core sequence is break of structure (BOS), then a wait for the retracement into the origin of the move.
- Most losing beginners described in the comments chase the break itself instead of waiting for the pullback.
- A 1-minute scalping approach multiplies the number of decisions per session, so mistakes compound faster than on higher timeframes.
- A written plan with fixed risk per trade matters more than adding a fourth or fifth course to the library.
Questions & answers
What is price action trading in simple terms?
It is reading the chart through structure, liquidity and candle behaviour rather than indicators. You identify where a swing broke, where the move originated, and whether the return to that area is strong enough to trade. The goal is a short list of repeatable scenarios instead of a screen full of conflicting signals.
Why do traders get stopped out right after a break of structure?
Because they enter on the breakout candle, exactly where the crowd is positioned. Price often returns to the origin of the move to fill orders and collect that liquidity before continuing. Waiting for the retracement gives a tighter stop and a better entry price.
Is 1-minute scalping suitable for a beginner?
Rarely. Costs, slippage and the sheer number of decisions per session punish small mistakes quickly, and tilt after a loss compounds the damage. Learning structure on 5-minute or 15-minute charts first keeps the same concepts while reducing noise and transaction costs.
Do I need indicators if I trade price action?
No, they are optional context rather than a requirement. Structure, key levels and a defined trigger are enough to make decisions. If a tool has not changed a decision in your last twenty trades, it is adding complexity without adding edge.
Source: Once You Learn Price Action, Trading Becomes Embarrassingly Simple · Markdown version